
RICE: Four factors for assessing priority
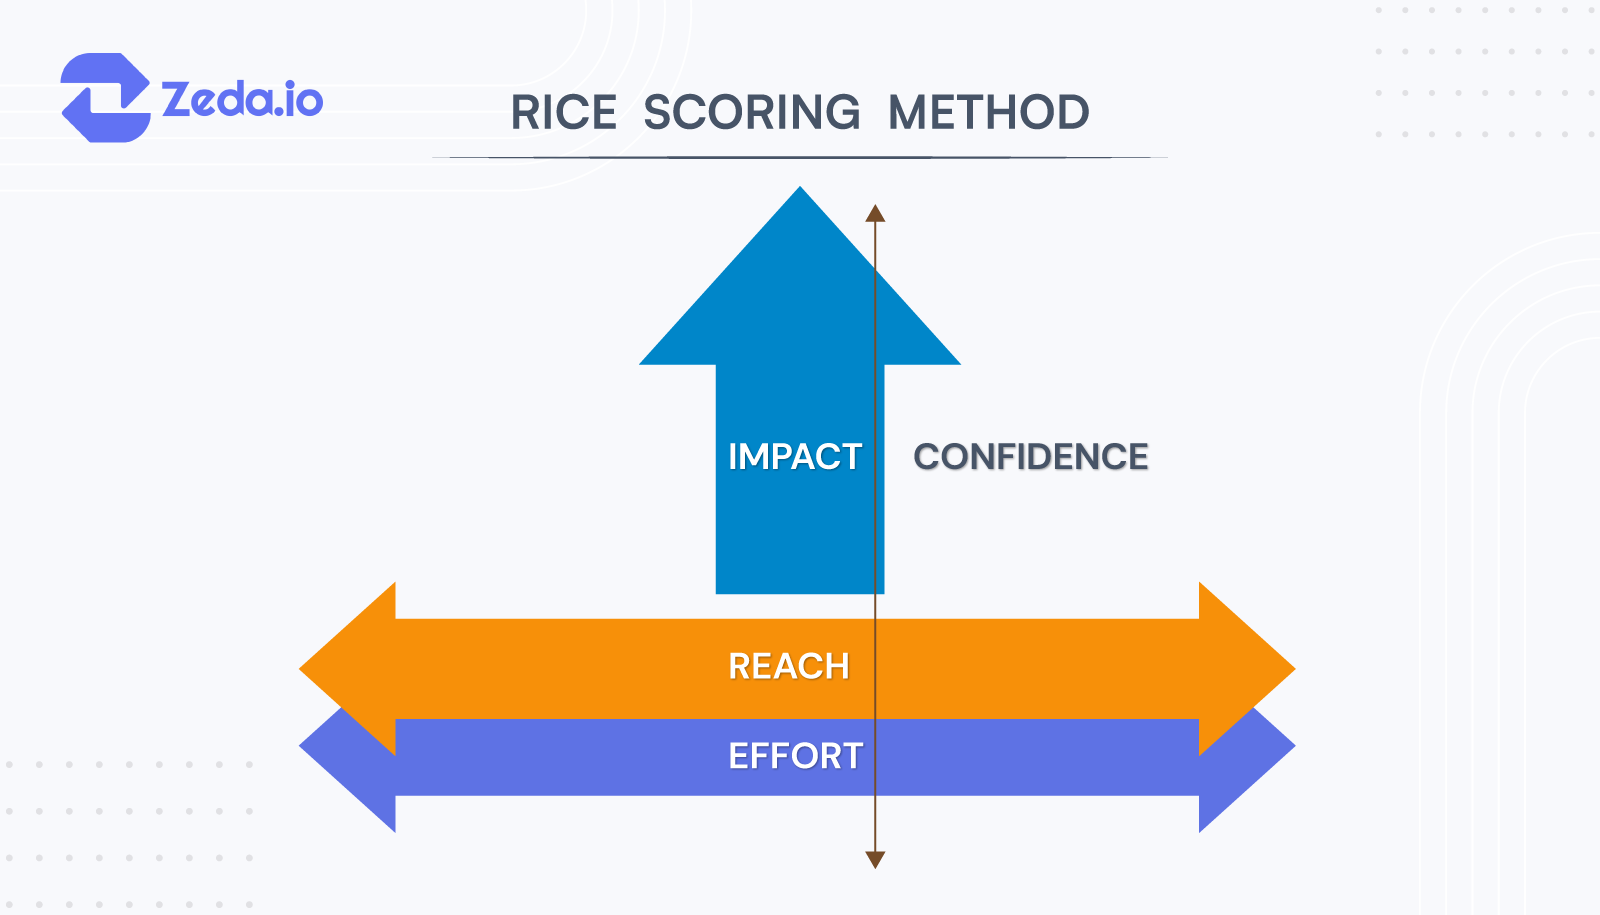
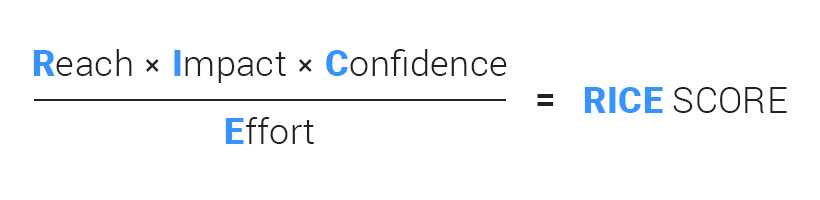
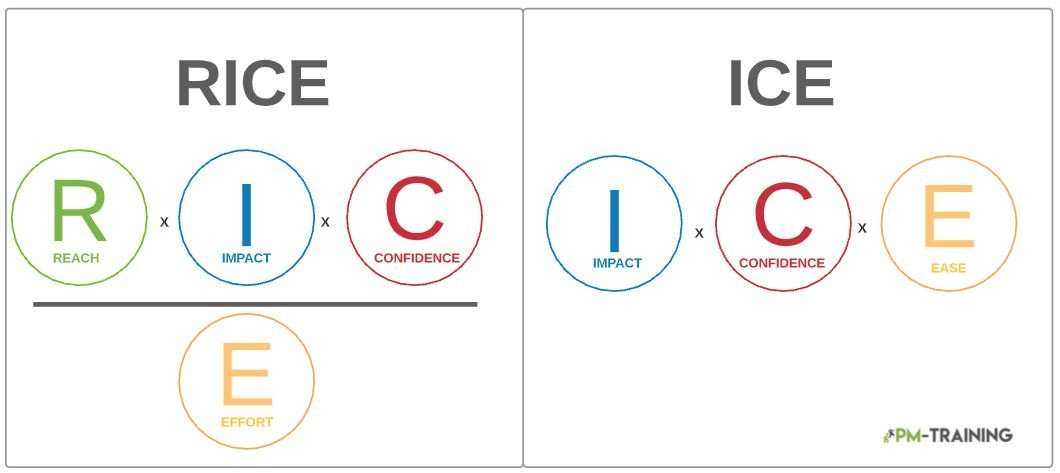
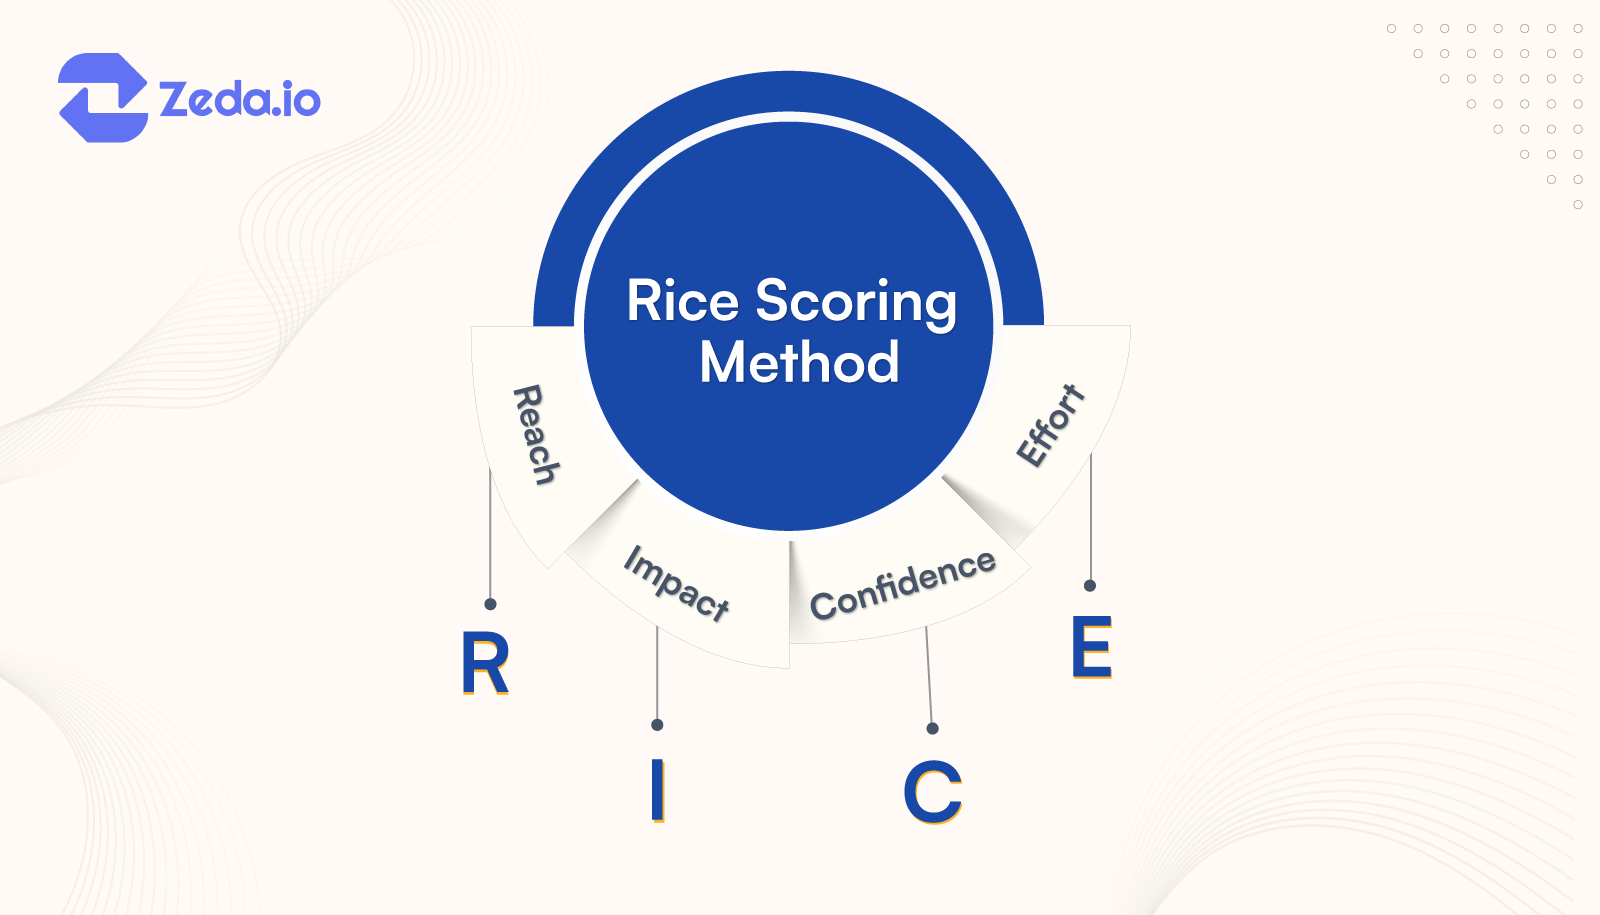
RICE is an acronym for the four factors we use to evaluate each project idea: reach, impact, confidence and effort.
Reach
To avoid bias towards features you’d use yourself, estimate how many people each project will affect within a given period. For my team, it’s “how many customers will this project impact over a single quarter?”.
Reach is measured in number of people/events per time period. That might be “customers per quarter” or “transactions per month”. As much as possible, use real measurements from product metrics instead of pulling numbers from a hat.
Example
- Project 1: 500 customers reach this point in the signup funnel each month, and 30% choose this option. The reach is 500 × 30% × 3 = 450 customers per quarter.
- Project 2: Every customer who uses this feature each quarter will see this change. The reach is 2,000 customers per quarter.
- Project 3: This change will have a one-time effect on 800 existing customers, with no ongoing effect. The reach is 800 customers per quarter.
Impact
To focus on projects that move the needle on your goal, estimate the impact on an individual person. For my team, it’s “how much will this project increase conversion rate when a customer encounters it?”. Your team might replace this with another goal, such as “increase adoption”, or “maximize delight”.
Impact is difficult to measure precisely. So, I choose from a multiple-choice scale: 3 for “massive impact”, 2 for “high”, 1 for “medium”, 0.5 for “low”, and finally 0.25 for “minimal”. These numbers get multiplied into the final score to scale it up or down.
Choosing an impact number may seem unscientific. But remember the alternative: a tangled mess of gut feeling.
Example
- Project 1: For each customer who sees it, this will have a huge impact. The impact score is 3.
- Project 2: This will have a lesser impact for each customer. The impact score is 1.
- Project 3: This is somewhere in-between in terms of impact. The impact score is 2.
Confidence
To curb enthusiasm for exciting but ill-defined ideas, factor in your level of confidence about your estimates. If you think a project could have huge impact but don’t have data to back it up, confidence lets you control that.
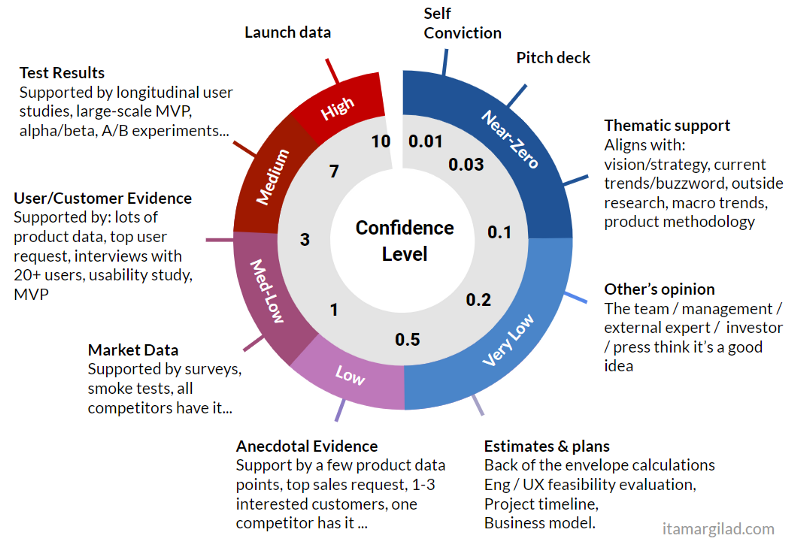
Confidence is a percentage, and I use another multiple-choice scale to help avoid decision paralysis. 100% is “high confidence”, 80% is “medium”, 50% is “low”. Anything below that is “total moonshot”. Be honest with yourself: how much support do you really have for your estimates?
Example
- Project 1: We have quantitative metrics for reach, user research for impact, and an engineering estimate for effort. This project gets a 100% confidence score.
- Project 2: I have data to support the reach and effort, but I’m unsure about the impact. This project gets an 80% confidence score.
- Project 3: The reach and impact may be lower than estimated, and the effort may be higher. This project gets a 50% confidence score.
Effort
To move quickly and have impact with the least amount of effort, estimate the total amount of time a project will require from all members of your team: product, design, and engineering.
Effort is estimated as a number of “person-months” – the work that one team member can do in a month. There are many unknowns here, so I keep my estimates rough by sticking to whole numbers (or 0.5 for anything well under a month). Unlike the other positive factors, more effort is a bad thing, so it divides the total impact.
Example
- Project 1: This will take about a week of planning, 1-2 weeks of design, and 2-4 weeks of engineering time. I’ll give it an effort score of 2 person-months.
- Project 2: This project will take several weeks of planning, a significant amount of design time, and at least two months of one engineer’s time. I’ll give it an effort score of 4 person-months.
- Project 3: This only requires a week of planning, no new design, and a few weeks of engineering time. I’ll give it an effort score of 1 person-month.
Ways to improve RICE scores
As a product manager, you essentially have 4 levers to increase the value of your initiatives: increase reach, increase impact, increase confidence, or decrease effort.
To increase reach, look for ways to scale your impact to more users overall, but without significantly increasing effort.
For B2B products, you can use tactics like configurations (enabling different customers to have different experiences), abstraction (enabling other product teams to leverage your work), and training and enablement (empowering customer-facing teams to successfully implement your products within their customers).
For B2C products, you can use tactics like virality (enabling products to spread from current users to new users) and partnerships (accessing your partner’s user base and allowing them to access your user base).
To increase impact, look for ways to solve a deeper customer pain than the pain they said they had. As an example, giving users the ability to “turn off all notifications” is more powerful than forcing users to have to turn off each notification one at a time.
To increase confidence, gather additional research and data to back up your product bet. Run in-product analytics to get a stronger grasp of how features interact with one another, and leverage user interviews, user feedback, and rapid prototyping to prove that your bet will solve a real pain.
To decrease effort, find ways to eliminate low-value-add work from any feature set. After all, most feature sets contain a mix of high-value work and low-value work, and the low-value work can always be punted to future iterations.
Note that when you consider how to decrease effort, try not to cut away engineering work that enables abstraction, scalability, and reusability. That’s because these efforts increase the impact of your bets. At the end of the day, you don’t want to ship functionality that no one else in your product organization can take advantage of!
Now we understand how to maximize the impact of our work through the lens of RICE. But, let’s carefully consider the caveats that are inherent to the RICE prioritization framework.
Why use the RICE Score Framework
The RICE Score Framework has several benefits for prioritizing tasks. First, it provides a systematic and data-driven way to evaluate initiatives. By considering factors such as Reach, Impact, Confidence, and Effort, teams can make more informed decisions about where to allocate their time and resources. This can help prevent teams from pursuing low-impact initiatives that require a significant amount of effort.
Additionally, the RICE Score Framework can help teams prioritize tasks more effectively. Prioritization is critical for any team working on multiple initiatives simultaneously. By using the RICE Score Framework, teams can avoid getting bogged down in low-priority tasks and focus on initiatives that will have the greatest impact on the business.
What is RICE prioritization?
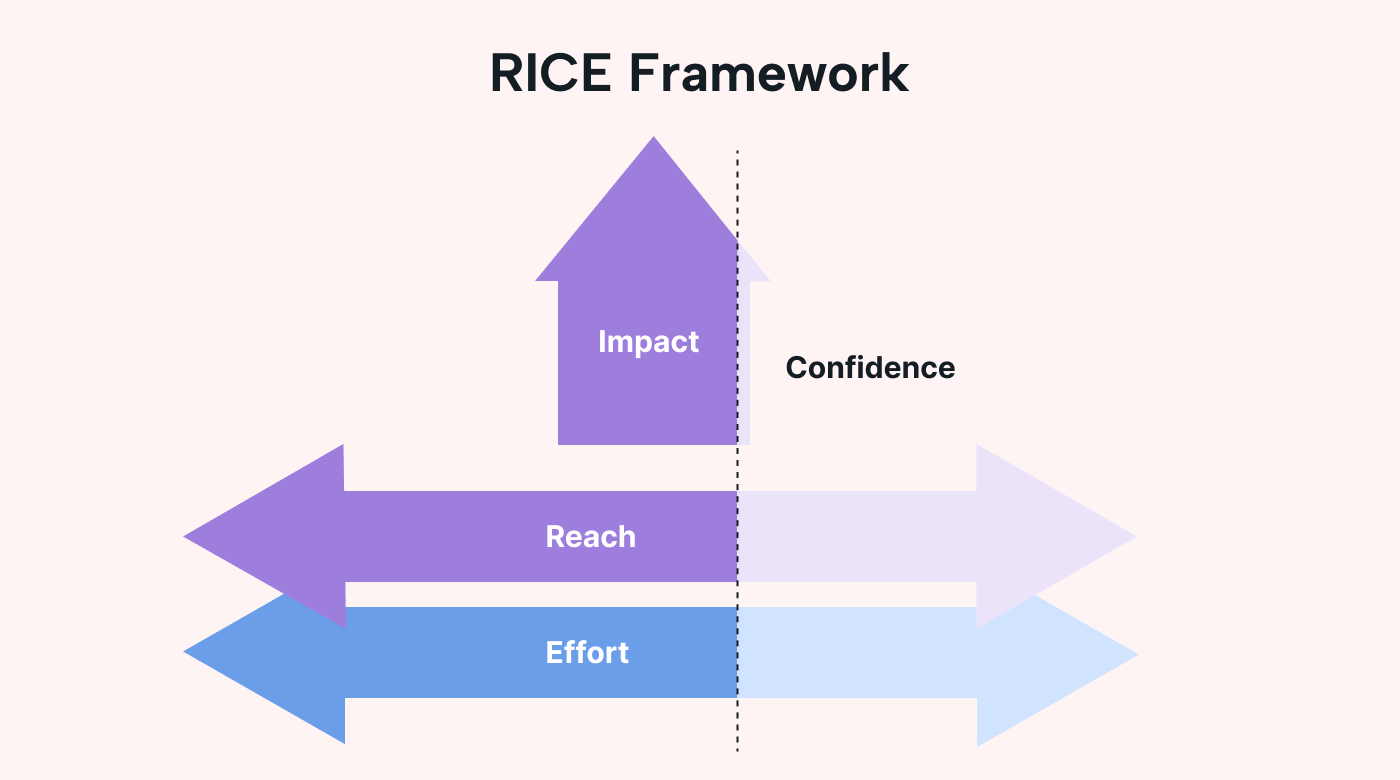
RICE is an acronym for reach, impact, confidence, and effort. It’s a framework for prioritizing projects, tasks, or initiatives based on their potential impact, required resources, confidence level, and effort involved.
 |
With this framework, you can make better-informed decisions about which tasks, products, or projects to prioritize based on their potential impact, feasibility, and resource allocation. So instead of taking a stab in the dark and hoping for the best, you can figure out exactly what areas of work you should be prioritizing (and why they’re important).
Take a look at this to see it in action.
Confidence
The third criteria in the RICE framework is Confidence. Confidence is all about how confident you are with the Reach, Impact and Effort scores you have given. This allows for ideas that we have greater confidence with, for example, ideas that we have data to support or have done appropriate discovery or user testing on to be favored over ideas which are close to a ‘wild guess’.
When calculating confidence ask yourself “how confident am I about the scores I have given for Reach, Impact and Effort?”
Confidence within RICE prioritization is defined as a percentage. As a guide, you can divide confidence up into:
- High confidence = 100%
- Medium confidence — 80%
- Low confidence = 50%
- Below 50% is a wild guess.
Since confidence is a percentage, what it does is penalize ideas where we have little confidence in the idea. For example, an idea may have really high impact and reach scores but if confidence is 50% then the final score will be half of what it would be if our confidence was 100%.
This makes confidence a great forcing function for performing SPIKES and discovery. The way you increase confidence is through learning.
Low confidence scores aren’t necessarily bad, nor do they exclude an idea by default. Rather, what confidence does is ensure that we immediately don’t take on work when we have low confidence in its success. Instead, we invest time gaining confidence by performing technical SPIKES and doing product discovery. This can be done whilst also working on higher confidence ideas, where we have more clarity.
By doing so we ensure that we are making data-informed decisions and that the scores in our RICE prioritization aren’t completely made up and when they are they should be appropriately scaled as a result.
Factors to consider before using RICE Scoring Model
Before using RICE prioritization framework, they are a few things you need to consider:
1. RICE is not a scientific method.
The decision to focus on a lower-scoring initiative or to discard a feature with a higher score could be influenced by various factors, such as the dependencies between two projects.
2. There are various ways to calculate each element of the RICE method.
It’s important to make sure RICE aligns with your company’s strategy and methodologies before you implement it, and keep the first implementation steps simple to drive adoption.
3. Start by asking the right questions
- How to quantify your REACH?
- How to qualify your IMPACT?
- How to assess your CONFIDENCE level?
- How to estimate your EFFORTS?
Now that you have a better understanding of how the RICE system works, it’s time to examine it in more depth.
Potential customizations for RICE prioritization
Just because we’ve proposed a more simplified version of RICE doesn’t mean that your organization can only use this one version.
After all, product managers work in context, and therefore you should treat this in-depth guide more as a set of flexible frameworks rather than a prescriptive “one-size-fits-all” solution.
Here are some ways in which you can customize the RICE framework for your organization’s specific needs:
-
You could change the weighting for the different scales, e.g. use Fibonacci (1, 2, 3, 5,
 instead of powers of two (0.5, 1, 2, 4,
 -
-
You could create different feature buckets, e.g. Adam Nash’s Three Buckets system of metric movers, customer requests, and customer delight
-
You could add additional granularity to each of the different RICE factors
![Rice prioritization framework for product managers [+examples]](https://triathlon21.ru/wp-content/uploads/7/d/b/7dbaee97fd2442f294b2cecb20ca5a40.png)
From a “defaults” perspective, we don’t usually recommend bucketing since that triggers a potential apples-to-oranges evaluation problem. You’ll run into challenges identifying how to trade off initiatives across categories.
Bucketing only works if you have a clearly-defined “point allocation mix” for each bucket, e.g. in Q2 you’ve allocated 40% of bandwidth into metric movers, 20% of bandwidth into customer requests, and 40% of bandwidth into customer delighters.
We also don’t recommend adding more than 5 categories to any axis. Too many categories causes unnecessary complexity that doesn’t provide additional signal when it comes to the right sequence of work.
As a last word of advice: while you should feel free to customize the RICE model for your organization’s existing decision-making processes, make sure that whatever model you use is consistent across all product managers within your organization.
RICE as a framework for assessing priorities
Quantify your REACH
An excellent way to think about this criterion is by tracking how many requests there are for a particular feature or how many customers will be affected over time.
It could be as simple as “How many users requested this functionality?”, “How many customers will this project impact over the next quarter?”. You could also consider the number of affected “transaction” or “activities” per month/week.
It mostly depends on what product metrics or KPI you decide to focus on. Check this article to find out which ones are the most relevant in your context.
What we recommend:
After using RICE internally, we recommend relying on the number of requests received through feedback, customer interview, chat support, etc. to quantify your reach.
Qualify your IMPACT
Impact also depends on what metric matters most for your business and what exactly you want to influence while building something new or improving something that already exists.
For Intercom, it was “How much will this project increase conversion rate when a customer encounters it?” It could also be, “How much will this initiative increase the number of users needed within one account?” or “How much will this feature drive the adoption of higher pricing plans?”
When the answer is «dramatic», your initiative will weigh XL. However, when it is «less significant», it will weigh closer to XS.
What we recommend:
After using RICE internally, we recommend leveraging the combined value of the customers who requested a specific feature to qualify your impact.
Assess your CONFIDENCE level
It is easy to get excited about a new project as a result of your level of confidence, so addressing your level of confidence will compensate for a lack of information, skills, or resources for this project.
The confidence level is often given as a percentage, but you could consider it as a score of 50 for instance.
While calculating your confidence level, be honest with yourself:
- Do you have metrics to back up your reach and impact research?
- Can you continuously track them to measure evolutions?
Give your project a 100% chance or 50/50 score.
Are your customers asking for AI and you are still hiring the right resources to build it? Give your project a 70% chance or a quality score of 30/50.
You may have a hard time measuring a project’s reach and impact compared to what you evaluate. Your initiative should not get more than a 50% chance or a 20 percent confidence score.
What we recommend:
After using RICE internally, we recommend measuring your confidence level by asking all of the main stakeholders to separate communicate their confidence scores over 100 points. Then, remove the highest and lowest scores and calculate your average confidence score.
Estimate your EFFORTS
Once we know how many people will be affected, how much will they impact, and how confident we are that all of this will occur, we can calculate the effort to find a path that will encounter less resistance.
There are a few functionalities that would have a high reach and impact with a low level of effort and a high level of confidence. This could be measured in terms of «people per month» or as «number of days/weeks» to develop.
As for the number of people per month, this will be more difficult to gauge since you have to do some math. Our advice based on our own experience is to use an approximate number of days involved to plan, develop, verify, and deploy the project you assess.
What we recommend:
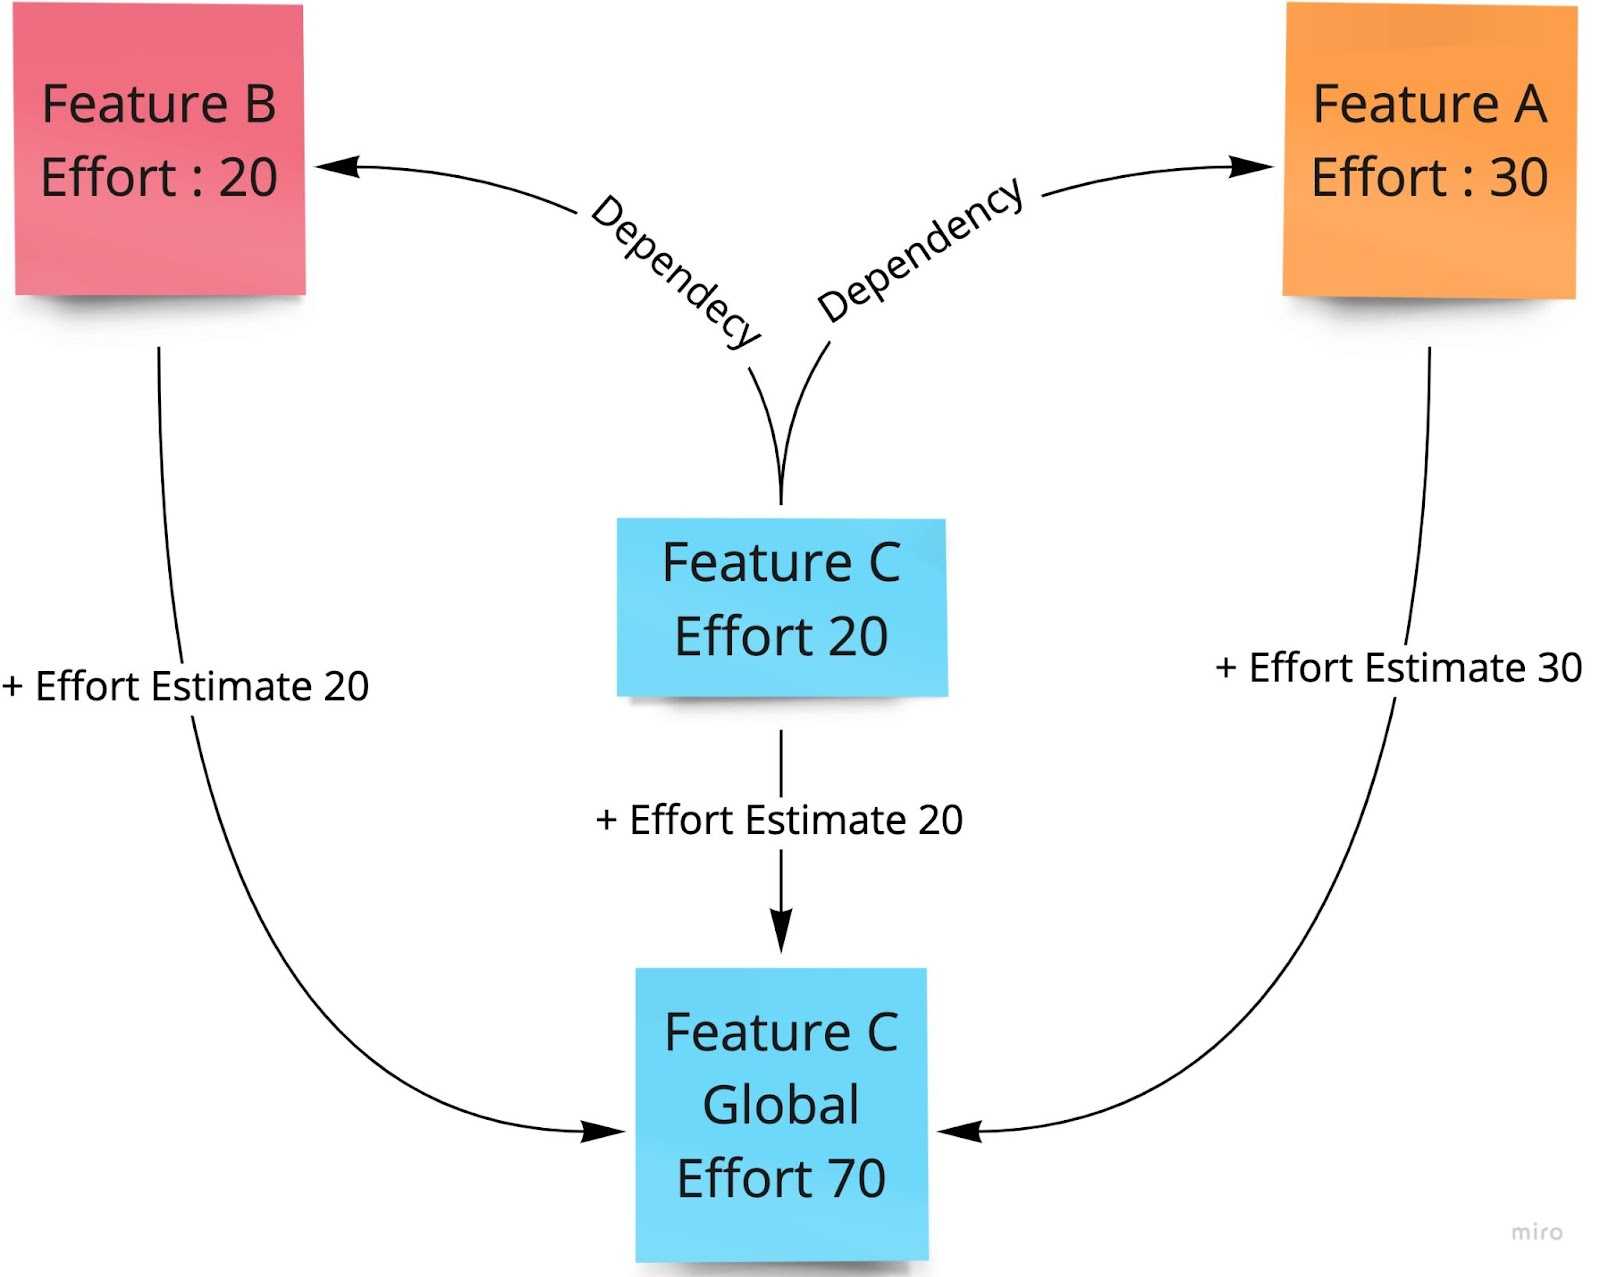
In order to estimate your effort, we recommend that you first think about it in terms of days of development and ask your development team to get a close estimate. Once you have this estimate, you can take into consideration dependencies with other projects and the effort involved with those.
If the number of dependencies is over two, we recommend you to apply a factor 2 on your effort estimate to cover the dependency aspect, or simply add the effort estimate of the 2 dependencies as well, if they have been forecasted already.
Rice Effort Estimation Example :
Will You Use the RICE Method?
If you’re struggling to prioritize the projects, products, features, or ideas on your list, why not give the RICE method a try? You can always create the prioritization tool with your team, or enter your own ratings and have another person check it for you.
For other ways to prioritize items, like a list of tasks, take a look at how to use the Eisenhower matrix method.
Image credit: Pixabay. All screenshots by Sandy Writtenhouse.
Is this post useful?
Subscribe to our newsletter!
Our latest tutorials delivered straight to your inbox
Sandy Writtenhouse
With her BS in Information Technology, Sandy worked for many years in the IT industry as a Project Manager, Department Manager, and PMO Lead. She wanted to help others learn how technology can enrich business and personal lives and has shared her suggestions and how-tos across thousands of articles.
Should Product Managers use RICE?
Why would you use the RICE prioritization method over other frameworks, and how can you encourage your team to adopt it?
The RICE model is a validation process to organize well-defined initiatives into an impact-based roadmap. It is not a magic formula to determine what your strategy should be or to transform vague ideas into a vision.
Your strategy and vision have to be set way before you decide to prioritize your roadmap. This is one of the important principles you need to know to build a Product Roadmap.
As a recurring team exercise (monthly or quarterly), the RICE methodology encourages your team to think about the problem they are solving from a specific perspective and with a number of advantages.
- Metric definition: Thinking about your product improvements with RICE framework in mind will help your team redefine what metric matters when it comes to success.
- Data-driven decision: To utilize RICE scoring model, you need to consider clear data points such as a number of requests or an overall number of users affected by a feature, removing emotions and opinions from the prioritization debates.
- Flexible Framework: You can easily adapt the model to your reality. Use it to prioritize ideas, features, initiatives.
- Favor alignment: Because the score covers critical variables, everyone can understand how it will help you align everyone on your roadmap, internally and externally.
What is the RICE scoring model?
The RICE scoring model is broken down into four sections.
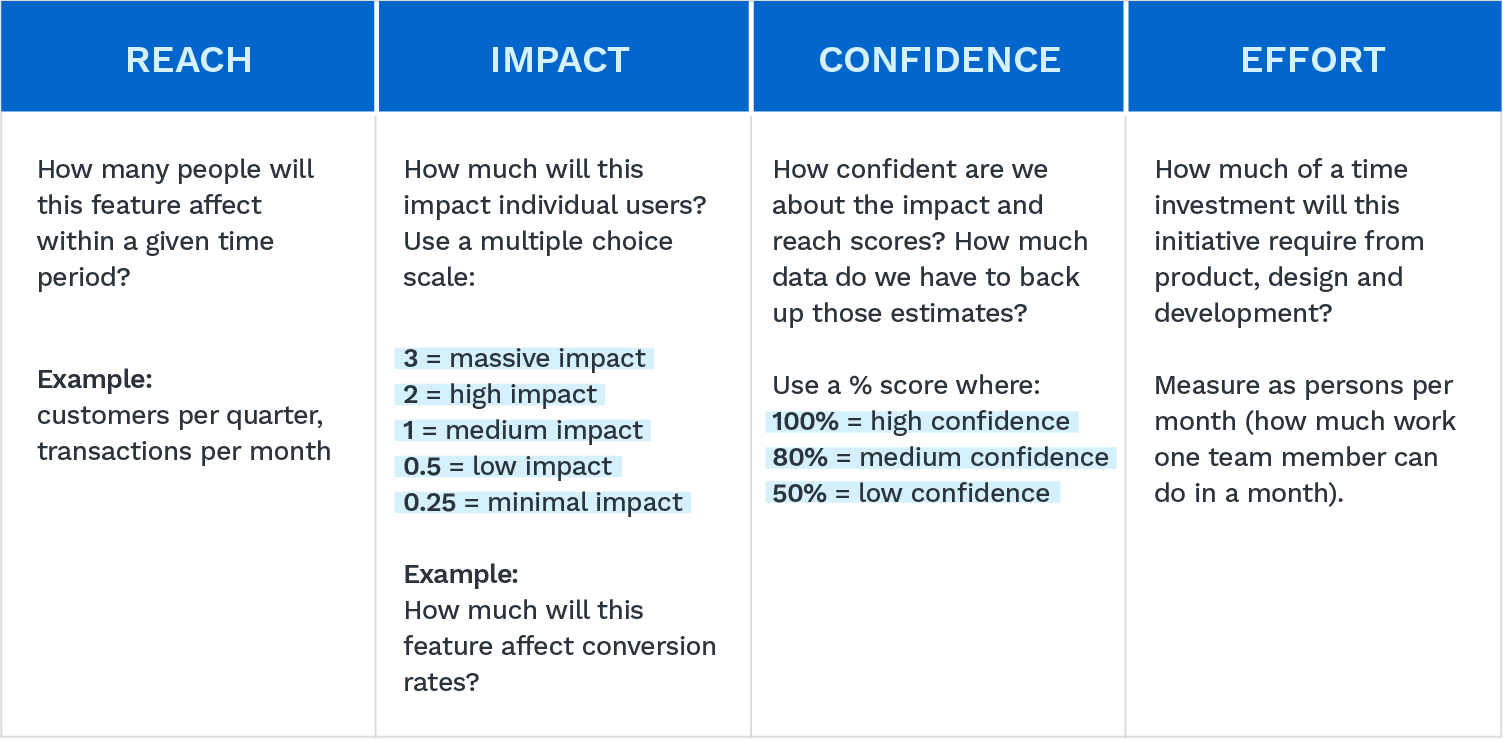
- Reach: How many people will this feature or product influence or affect?
- Impact: How weighty will this feature be on important project and business outcomes? (e.g. conversion rates)
- Confidence: How confident are you in your estimates for Reach and Impact?
- Effort: How costly or effortful will it be to build this feature or product?
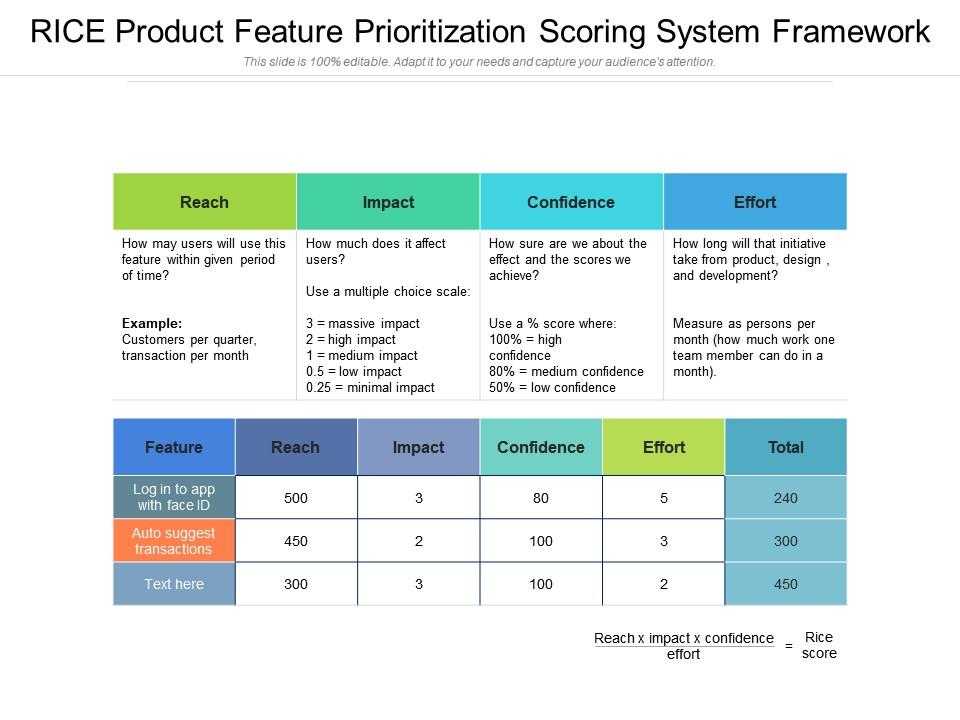
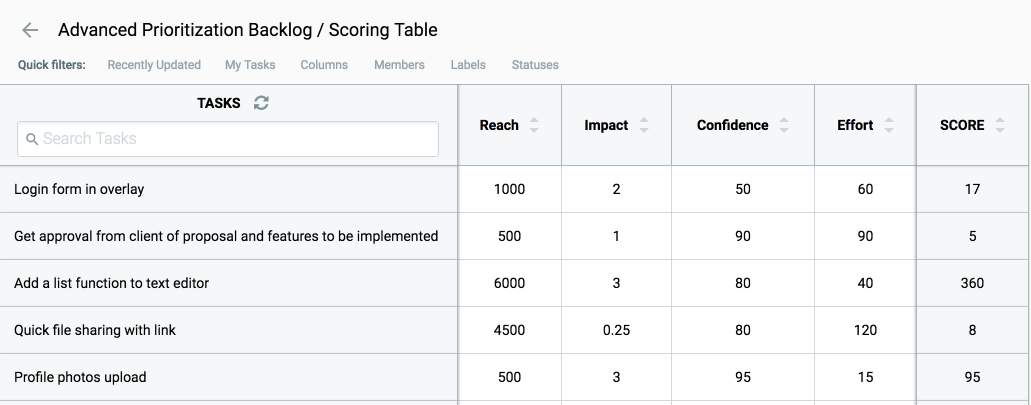
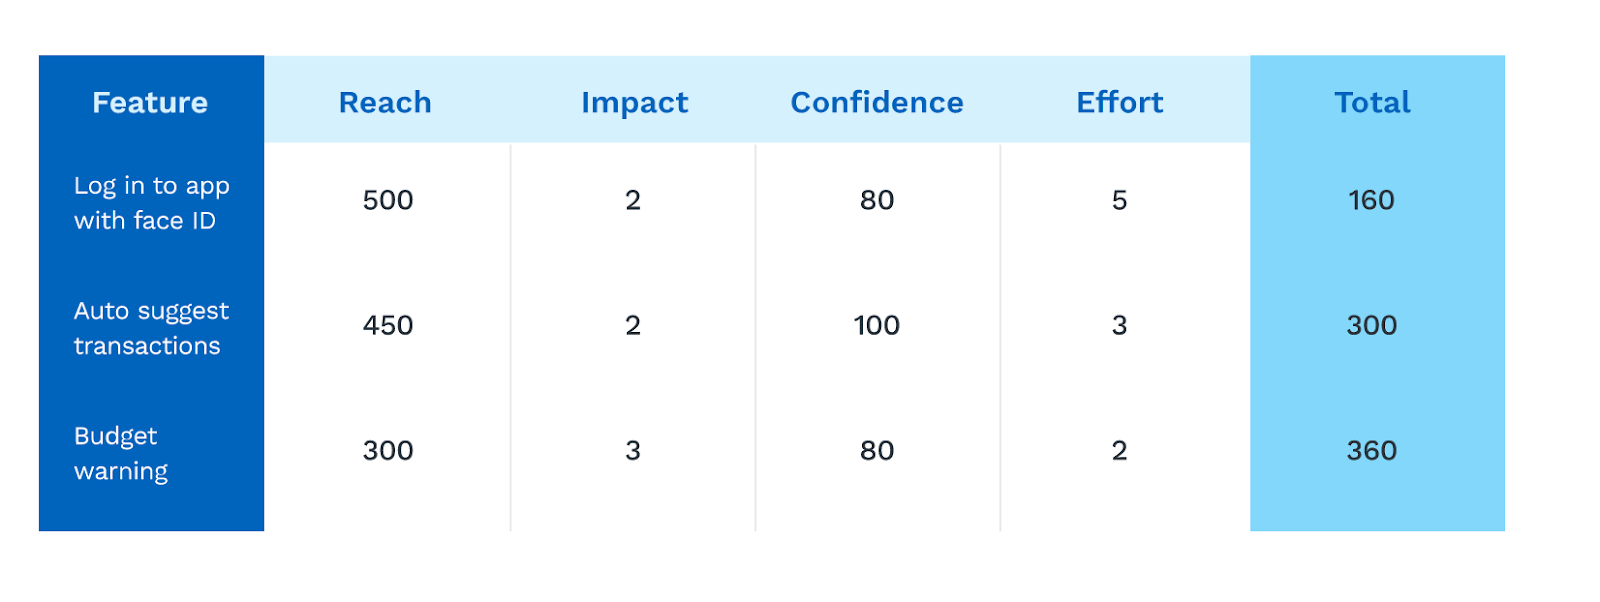
These sections are each scored, and a formula is used to derive the final RICE score for any given product or feature.
So, when performed in a table of features, you can quickly sort and rank different features based on their final RICE score—which can be especially helpful when the feature list is long and resources are scarce.
Reach
The first factor looks at how many people your feature or initiative will reach in the given timeline. The first thing to do before listing Reach scores is to settle on a clear metric.

![Rice scoring framework template [notion calculator & formula] | landmark labs](https://triathlon21.ru/wp-content/uploads/5/e/7/5e706adb899d7d59f1c6bf684117376c.png)
You can always use a scale of 1-10 to keep this even, but if you have real data to work with that may not be the most helpful thing.
But not all ‘impressions’ are equal. Say one initiative looked like it might bring 1,000 visitors to a key landing page, while another initiative might get 50,000 facebook impressions… it’s clear that these aren’t really the same thing, and so it wouldn’t be helpful to include 1,000 versus 50,000 in the Reach column of your framework.
Instead, it’s important to establish a common metric by which to compare your features and initiatives—worst case, if you can’t settle on a good metric, you can always give a rating from 1 to 10 or 1 to 100, based on the total ‘magnitude’ of reach… however you eventually plan to measure that.
Impact
Impact, on the other hand, is scored on a common 5 point scale. Intercom’s original scale looked like this:
- 3 = massive impact
- 2 = high impact
- 1 = medium impact
- .5 = low impact
- .25 = minimal impact
Confidence
Confidence how confident you are in your estimates for Reach and Impact. If you have strong data to support your Reach estimates, say, but not as much for the Impact, then you might give a somewhat milder confidence rating than if you have good reasons to support your estimates on both fronts.
Like with all other scores, you can do this on a feature by feature basis.
As a guide, you can use:
- 100% = High confidence
- 80% = Medium confidence
- 50% = Low confidence
Effort
Lastly, Effort can be used as a literal metric that reflects the number of ‘person-months’ needed to complete a feature or project. Or, you can also substitute a 1-5 rating if you’re not working on a team or have a more appropriate way of measuring business resources for your situation.
As a note, Intercom listed anything under 1 month as a ‘.5’ score.
What is RICE?
RICE is a Product Management prioritization framework that originated at Intercom. Sean McBide, one of the Product Managers there at the time, co-developed the RICE framework to improve their decision-making process and solve several problems Product Managers were facing. You can read his original article on the RICE framework here.
McBide and his colleagues found that as a company the way they were prioritizing favored ‘pet projects’ rather than the ideas which impacted the most customers. Further they found there wasn’t enough scrutiny on how proposed ideas impacted their goals. And lastly, Sean notes in his original article on RICE Prioritization was that many of the prioritization frameworks out there seldomly factored in things like confidence.
In the end, McBide and his colleagues decided to develop a prioritization framework themselves and the RICE Prioritization framework was formed.
The RICE framework is a form of prioritization scorecard that uses the criteria: Reach, Impact, Confidence and Effort, which by no coincidence, make up the acronym RICE.
Since the RICE framework is a prioritization scorecard each attribute is given a number and it formulates those into a final score known as the RICE Score.
Since its humble beginnings at Intercom, the RICE framework has become one of the most popular prioritization frameworks in product management. A recent survey done by ProdPlan, in 2020, found RICE to be the 5th most used prioritization framework.
Understanding the RICE Score Framework
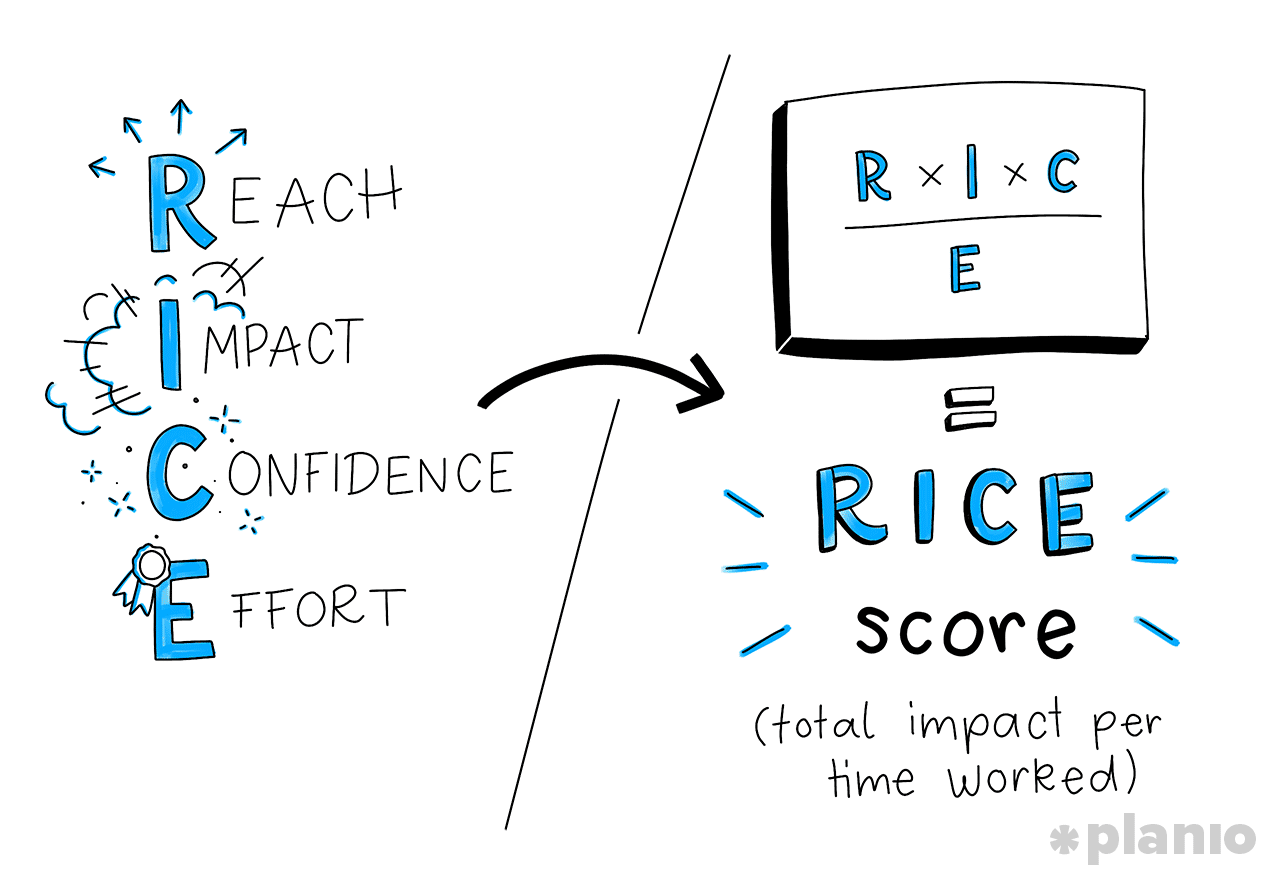
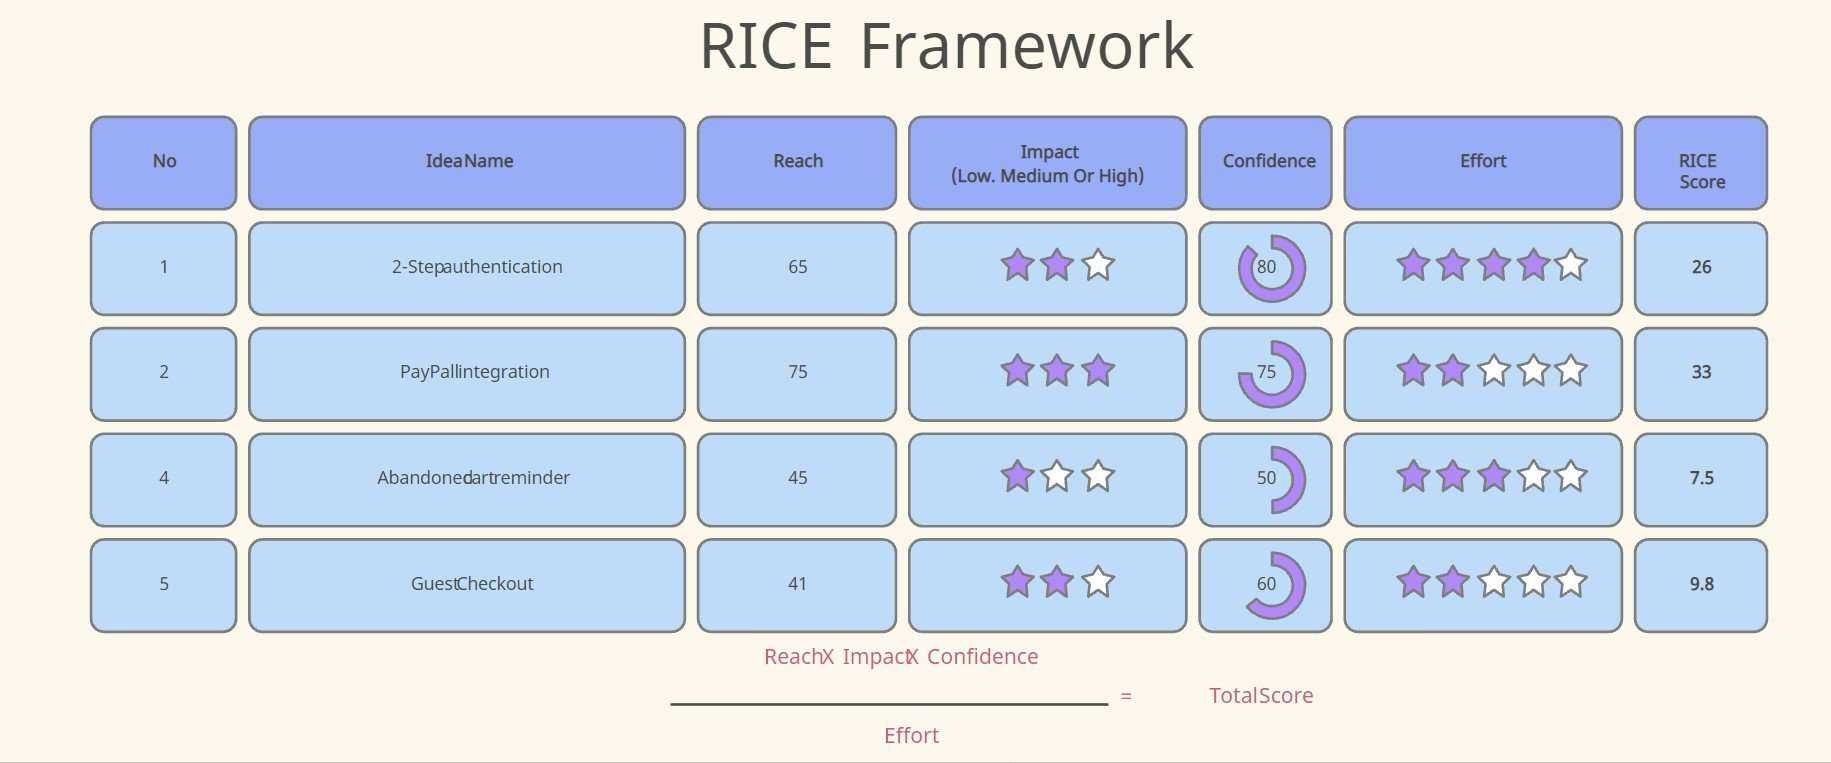
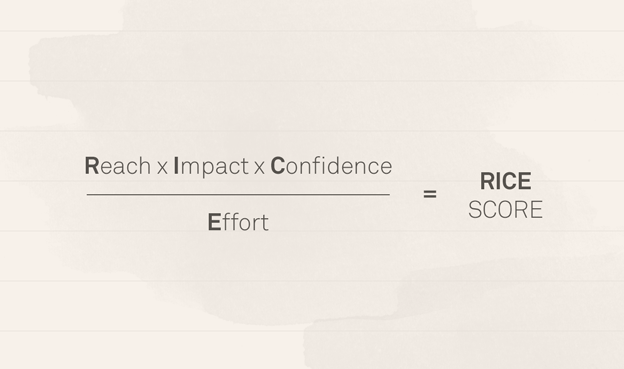
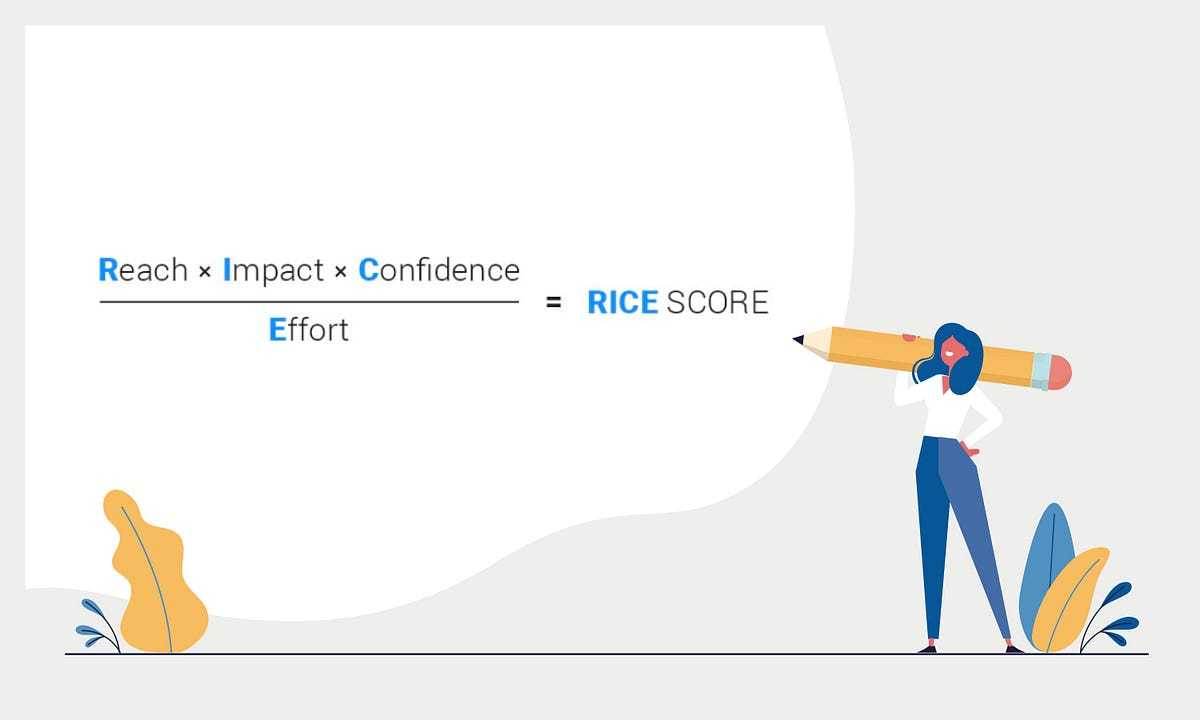
The RICE Score Framework is composed of four key components: Reach, Impact, Confidence, and Effort. Each component is assigned a score from 1 to 10, which are multiplied to calculate the RICE score. The RICE Score is calculated by means of Rice Score Formula, which is depicted in the image above. It is a simple mathematical equation, (R x I x C)/E, where R, I, C, and E, are Reach, Impact, Confidence, and Effort respectively.
RICE Prioritization Method
Let’s take a closer look at each component of the RICE Score framework.
Reach
Reach refers to the number of people affected by the initiative. The higher the reach, the greater the potential impact of the initiative. Reach can be estimated using data such as the size of the target audience or the number of users who will be affected.
Impact
Impact refers to the degree of impact on the user or business. This can include factors such as user satisfaction, revenue growth, or cost savings. It is important to consider both the magnitude and the duration of the impact when assigning an Impact score.
Confidence
Confidence refers to the level of certainty that the initiative will succeed. This can be based on factors such as market research, user feedback, or historical data. A high Confidence score indicates that the initiative is more likely to succeed, while a low Confidence score indicates a greater degree of uncertainty.
Effort
Effort refers to the amount of time and resources required to implement the initiative. This can include factors such as development time, cost, or required expertise. A higher Effort score indicates that the initiative is more difficult to implement.
Benefits of RICE
With such wide adoptance, RICE prioritization is a go-to favorite for product managers globally when it comes to choosing a prioritization framework. There are many reasons why and they all link back to the challenges that McBide and his colleagues were facing at Intercom. No different than where most Product Managers find themselves in, they too are seeking a framework that will help them address similar challenges.
Unlike some prioritization frameworks, RICE prioritization can be applied consistently across even the most disparate ideas.
By using numbers and actual data, like with reach, the RICE framework removes a lot of the subjectivity that comes with prioritization. Although you cannot remove subjectivity completely, by putting values down on paper we start to alter the conversation. If someone says it’s a 3 for impact we can ask them why, and if they struggle to support their choice it is easier to adjust by either downgrading the rating or by altering the confidence score.
Lastly RICE prioritization encourages product management best practices of being data informed and focusing on outcomes through impact.
Final Thoughts
The RICE framework, or Rice Scoring Model as it is often referred to, is a valuable tool for prioritizing initiatives based on data-driven decision-making. By assigning scores to each component — Reach, Impact, Confidence, and Effort — and calculating the RICE score, businesses can compare and prioritize initiatives based on their potential impact, feasibility, and expected reach.
While the RICE framework is just one tool in the decision-making toolkit, it can help businesses avoid common pitfalls and make more informed decisions. However, it is important to use the framework in conjunction with other decision-making frameworks and strategies and to review and update the scores regularly.
Ultimately, by using the RICE framework to prioritize initiatives, businesses can make strategic decisions that will drive growth, increase user satisfaction, and achieve their organizational goals.
Use Zeda.io to prioritize your features using the RICE Framework effortlessly. With Zeda.io, you may use various prioritization frameworks, such as RICE, Value-Effort, or using custom models, to make informed decisions about what to build next. Start now!
How Does the RICE Scoring Model Work?
To use the RICE scoring model, you evaluate each of your competing ideas (new products, product extensions, features, etc.) by scoring them according to the following formula: 
Reach
The first factor in determining your RICE score is to get a sense of how many people you estimate your initiative will reach in a given timeframe.
You have to decide both what “reach” means in this context and the timeframe over which you want to measure it. You can choose any time period—one month, a quarter, etc.—and you can decide that reach will refer to the number of customer transactions, free-trial signups, or how many existing users try your new feature.
Your reach score will be the number you’ve estimated. For example, if you expect your project will lead to 150 new customers within the next quarter, your reach score is 150. On the other hand, if you estimate your project will deliver 1,200 new prospects to your trial-download page within the next month, and that 30% of those prospects will sign up, your reach score is 360.
Impact
Impact can reflect a quantitative goal, such as how many new conversions for your project will result in when users encounter it, or a more qualitative objective such as increasing customer delight.
Even when using a quantitative metric (“How many people who see this feature will buy the product?”), measuring impact will be difficult, because you won’t necessarily be able to isolate your new project as the primary reason (or even a reason at all) for why your users take action. If measuring the impact of a project after you’ve collected the data will be difficult, you can assume that estimating it beforehand will also be a challenge.
Intercom developed a five-tiered scoring system for estimating a project’s impact:
- 3 = massive impact
- 2 = high impact
- 1 = medium impact
- .5 = low impact
- .25 = minimal impact
Confidence
The confidence component of your RICE score helps you control for projects in which your team has data to support one factor of your score but is relying more on intuition for another factor.
For example, if you have data backing up your reach estimate but your impact score represents more of a gut feeling or anecdotal evidence, your confidence score will help account for this.
As it did with impact, Intercom created a tiered set of discrete percentages to score confidence, so that its teams wouldn’t get stuck here trying to decide on an exact percentage number between 1 and 100. When determining your confidence score for a given project, your options are:
- 100% = high confidence
- 80% = medium confidence
- 50% = low confidence
If you arrive at a confidence score below 50%, consider it a “moonshot” and assume your priorities need to be elsewhere.
Effort
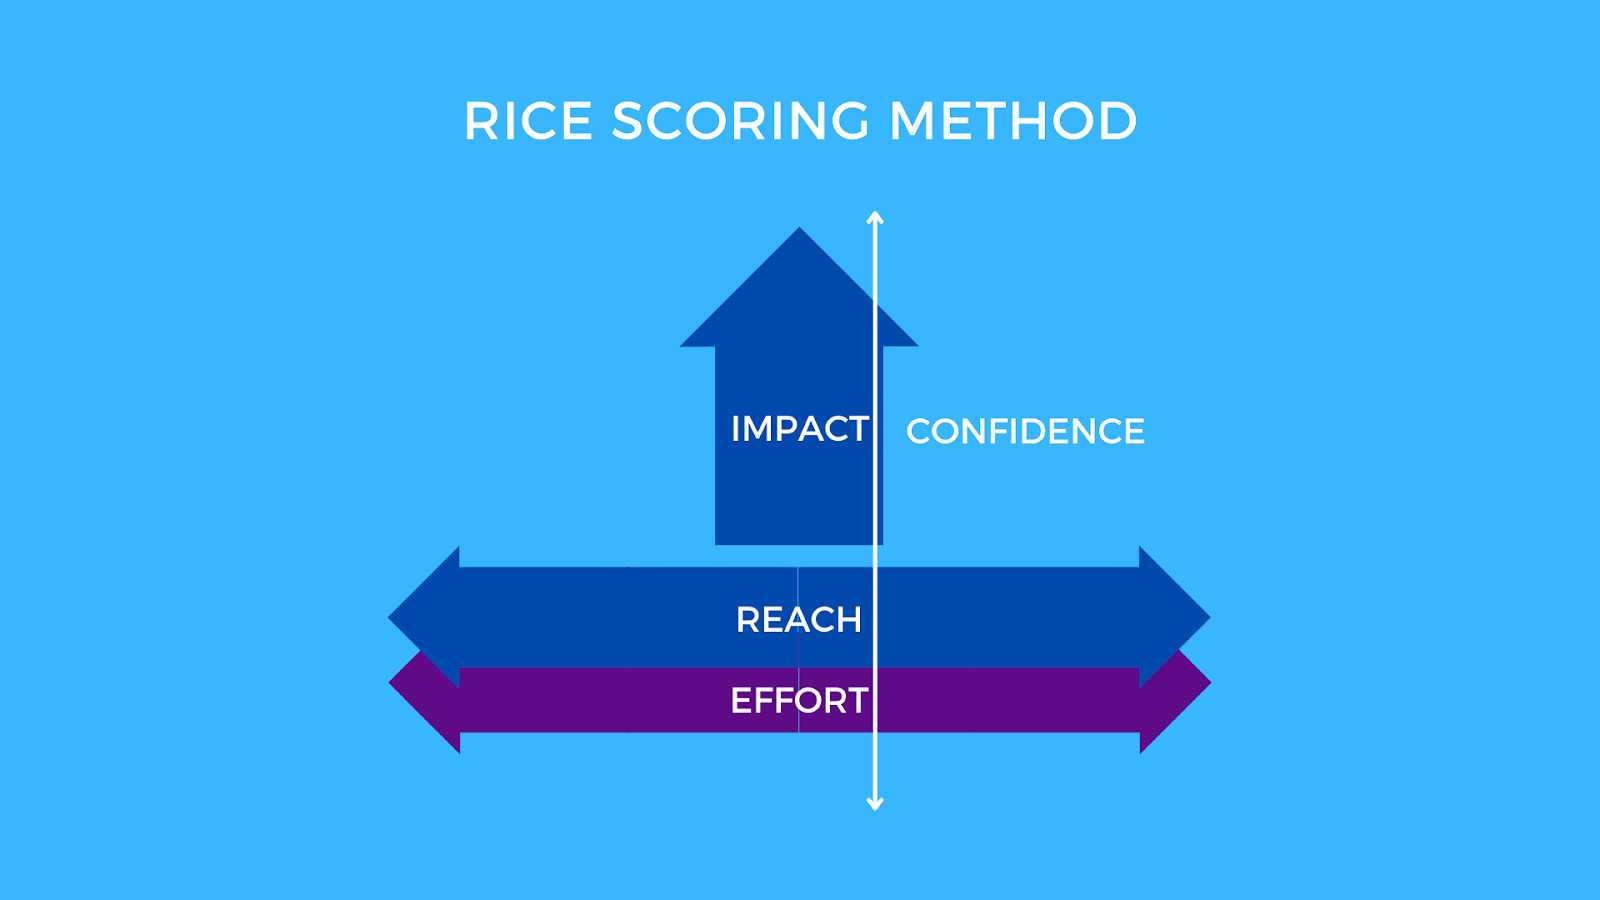
We have discussed alll of the factors to this point—reach, impact, confidence—represent the numerators in the RICE scoring equation. Effort represents the denominator.
In other words, if you think of RICE as a cost-benefit analysis, the other three components are all potential benefits while effort is the single score that represents the costs.
Quantifying effort in this model is similar to scoring reach. You simply estimate the total number of resources (product, design, engineering, testing, etc.) needed to complete the initiative over a given period of time—typically “person-months”—and that is your score.

Common pitfalls to avoid
While the RICE Score Framework can be a valuable tool for prioritizing initiatives, there are a few common pitfalls to avoid. First, it is important to ensure that the scores assigned to each component are accurate and based on data, rather than assumptions or personal biases. This can be achieved by conducting research, gathering user feedback, and analyzing historical data.
Second, it is important to consider the trade-offs between the different components. For example, an initiative with a high Impact score may also require a significant amount of effort to implement. In this case, it is important to consider whether the potential impact is worth the resources required.
Finally, it is important to remember that the RICE Score Framework is just one tool for prioritizing initiatives. It should be used in conjunction with other decision-making frameworks and strategies, such as cost-benefit analysis and SWOT analysis, to ensure a comprehensive approach.
Another common pitfall to avoid is failing to update the scores regularly. As circumstances change and new information becomes available, the scores assigned to each component may need to be revised. It is important to review and update the scores regularly to ensure that the prioritization process remains accurate and relevant.
It is also important to avoid using the RICE Score Framework in isolation. While the framework can help prioritize initiatives based on quantitative factors, it is important to also consider qualitative factors, such as organizational goals and values, when making decisions.
Lastly, it is important to avoid treating the RICE Score Framework as a strict rulebook. The scores assigned to each component are not set in stone, and there may be cases where exceptions should be made based on unique circumstances. It is important to use the framework as a guide, rather than a rigid set of rules to ensure that decisions are made in the best interest of the organization.
How to use the RICE framework to prioritize your work
If you’re thinking about using the RICE model to prioritize your work, here are the steps you can follow to use it effectively.
Define and score the RICE criteria
The first step to successfully using the RICE framework is to determine the scoring system or scale for each criterion. For example, you can use a scale of 1–10, 1–5, or anything else that works for you and your team.
When it comes to scoring your RICE criteria, be sure to work with your teammates. As we’ve already mentioned, if just one person is in charge of scoring tasks, the results can be skewed to their perspective. By including some of your colleagues in this process, you’ll make sure you have a more accurate scoring system.
When you know what your RICE scoring criteria will be, you can now outline all the features or products that you want to score. Then, you’ll move on to calculating the score for each item, which leads us nicely to our next step.
Calculate the RICE score
After assigning criteria, you can now calculate your RICE score for each feature or product that you want to prioritize. Use the to get your RICE score for each item.
Ideally, you should perform your calculations in a shared location. Why? For two reasons:
- It makes it easier to collaborate with your teammates.
- It provides a safe location for you to store all your calculations.
An online platform like Motion is a good example of a platform for creating and storing your RICE calculations. With our collaborative software, teams can access key project information from wherever they are in real time.
 |
This means that you can calculate your RICE scores in a centralized location that’s easily accessible. Plus, your teammates can add their own thoughts and suggestions by adding notes and tagging other users.
In other words, it makes it easy for everyone to work together and gives you a place to store all your RICE calculations for future reference. You never know when you might want to reflect on previous calculations to inform your business decisions.
Prioritize based on RICE scores
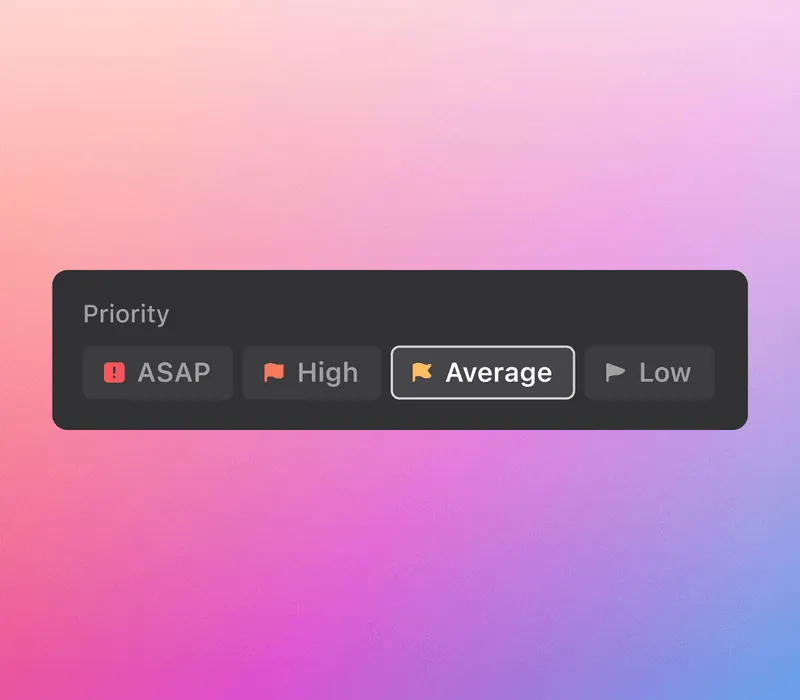
You have your RICE scores in place. Now you can select projects or assign tasks to your team based on which products or features the RICE scores said are more important. Remember — higher scores indicate a higher priority.
To make it easy to visualize the priority level of each task, consider using a platform like Motion. You can easily assign tasks a priority level, allowing you to instantly identify which tasks are the most important.
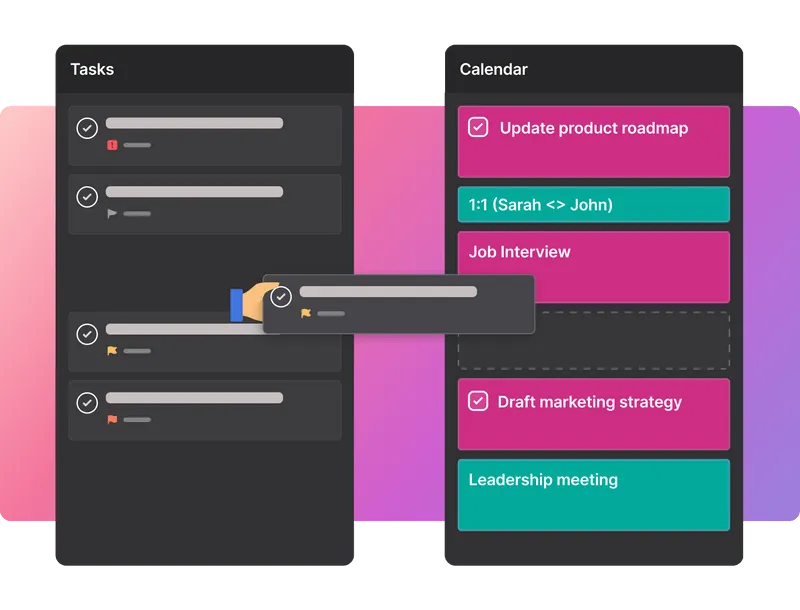
 |
And when you add these to our AI-powered calendar, we’ll automatically put the top-priority tasks ahead of everything else.
After categorizing your tasks, share this information with your project team to ensure that everyone’s on the same page. If there are any questions or concerns about the order of priority, use this as an opportunity to incorporate their feedback and answer their questions.
For example, if the marketing team is concerned about the number of top-priority tasks that are coming their way, you can discuss this with them and identify whether:
- They have the capacity to perform the work
- They agree that the items you’ve prioritized are the most important tasks
Hopefully, you shouldn’t have to deal with many queries or concerns at this stage. If you include the relevant people in the scoring process, the items should already be prioritized with all these concerns in mind.
Review and adjust
At this stage, you can take a step back and consider any additional factors, constraints, or dependencies that may influence the order of tasks. Then, you can make adjustments to get your items in the right order.
This is another example of how Motion can be helpful throughout this process. With our platform, you can easily shuffle and reprioritize tasks with our drag-and-drop feature.
 |
This makes it faster and easier for you to rearrange the order of your items. As a result, you can spend more time working on tasks to achieve your goals and less time manually juggling priorities.